Introduction
Enterprise defenders often have many agents running in the environment: SIEM, EDR, VPN, you name it. Having 100% of the agents running and healthy is a dream of every defender, but the reality is that it’s not always possible. Sometimes agents are broken: never installed, stopped by some administrator or just not working as expected.
It is a great idea to have a healthcheck for your agents to ensure that they are running and healthy.
Introducing the Whisperer
One day I was thinking if it would be possible to know how many agents are running and healthy in the environment. How many are stopped? How many are not installed? How many are working as expected? I started to think about it and I came up with the idea of a Whisperer.
The Whisperer is just a simple PowerShell script deployed in Active Directory environment using Group Policy. Script is running in scheduled task: running 10 minutes after the power on and once a day around noon.
Script is using PowerShell to pull the status of the agents from computer, checking if their service is running, their versions, etc. Additionally it is sending some useful information like: Microsoft Defender (status of updates, exclusions etc.), and system info (version, patch). We could add more things if we would like to.
PowerShell script
Proof of concept PowerShell script is available here. It basically does the following:
- Collects basic host information: hostname, domain, OS name, version, build number, install date and last boot time.
- Queries the status and version of key security agents: Elastic Agent, Elastic Endpoint, and Sysmon (we can configure other agents to be checked if we would like to).
- Pulls hardware and BIOS details for inventory purposes.
- Retrieves Microsoft Defender status, including definitions update state and configured exclusions.
- Ships everything as a single JSON payload via an authenticated HTTP POST to the Whisperer receiver endpoint.
Deployment using Group Policy
Deployment is straightforward using a GPO scheduled task. I won’t go into full GPO configuration here, but the key points are:
- Run as
SYSTEM— no user interaction required. - Trigger on startup (with a 10-minute delay to allow network stabilisation) and daily at noon (we can add some jitter to the time to avoid overloading the network).
- Script is stored in SYSVOL and is accessible from the machine account.
- Consider code-signing the script if your environment enforces PowerShell execution policy.
Elastic Stack integration
The script sends data to a simple HTTP listener — in my case, I’ve used Elastic Stack integration. I’ve added Basic Authentication to the endpoint to ensure that only the Whisperer can send data to the endpoint.
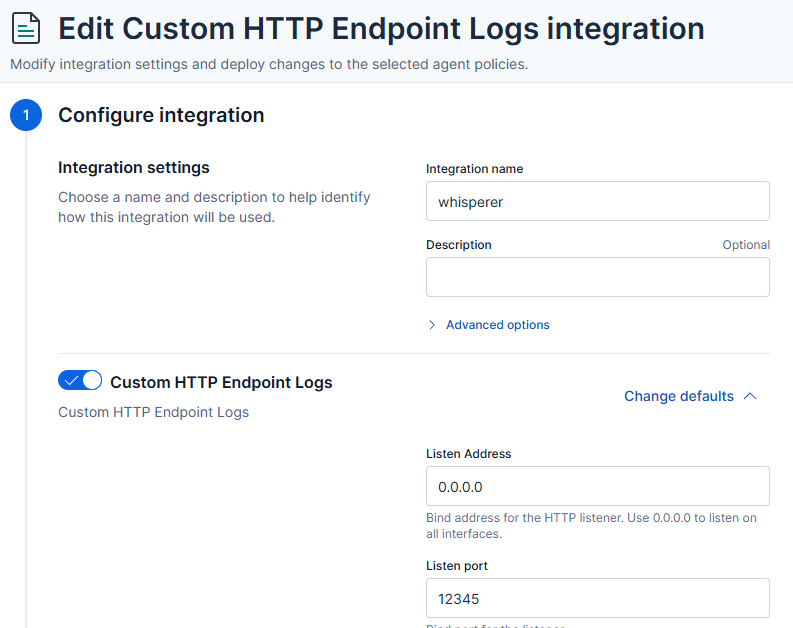
Full configuration of integration:
PUT kbn:/api/fleet/package_policies/whisperer-package-policy
{
  "package": {
    "name": "http_endpoint",
    "version": "2.5.0"
  },
  "name": "whisperer",
  "namespace": "",
  "description": "",
  "policy_ids": [
    "whisperer-server-policy"
  ],
  "vars": {},
  "inputs": {
    "http_endpoint-http_endpoint": {
      "enabled": true,
      "streams": {
        "http_endpoint.http_endpoint": {
          "enabled": true,
          "vars": {
            "method": "POST",
            "listen_address": "0.0.0.0",
            "listen_port": "12345",
            "data_stream.dataset": "whisperer",
            "pipeline": "whisperer",
            "preserve_original_event": false,
            "basic_auth": true,
            "username": "whisperer",
            "password": {
              "id": "2ebXkZ0B83xKn-wv4Mzj",
              "isSecretRef": true
            },
            "include_headers": [],
            "ssl": "enabled: false\ncertificate: \"/etc/pki/client/cert.pem\"\nkey: \"/etc/pki/client/cert.key\"\n",
            "tags": []
          }
        }
      }
    }
  }
}
I’ve also added a pipeline to the integration to parse the JSON payload and extract the relevant information.
PUT _ingest/pipeline/whisperer
{
  "description": "Whisperer endpoint inventory pipeline",
  "processors": [
    {
      "rename": {
        "field": "json",
        "target_field": "whisperer",
        "ignore_missing": true
      }
    },
    {
      "script": {
        "description": "Convert WMI /Date(epoch)/ to ISO8601",
        "lang": "painless",
        "source": """
          def fields = [
            ['whisperer', 'mpstatus', 'AntivirusSignatureLastUpdated'],
            ['whisperer', 'mpstatus', 'AntispywareSignatureLastUpdated'],
            ['whisperer', 'mpstatus', 'NISSignatureLastUpdated'],
            ['whisperer', 'mpstatus', 'DeviceControlPoliciesLastUpdated']
          ];
          for (def path : fields) {
            def obj = ctx;
            for (int i = 0; i < path.length - 1; i++) {
              if (obj == null || !(obj instanceof Map) || !obj.containsKey(path[i])) { obj = null; break; }
              obj = obj[path[i]];
            }
            if (obj == null) continue;
            def lastKey = path[path.length - 1];
            if (!obj.containsKey(lastKey) || obj[lastKey] == null) continue;
            def val = obj[lastKey].toString();
            def m = /\/Date\((-?\d+)\)\//.matcher(val);
            if (m.find()) {
              long epoch = Long.parseLong(m.group(1));
              obj[lastKey] = epoch > 0 ? Instant.ofEpochMilli(epoch).toString() : null;
            }
          }
        """
      }
    },
    {
      "date": {
        "field": "whisperer.created_at",
        "target_field": "@timestamp",
        "formats": ["ISO8601"],
        "ignore_failure": true
      }
    },
    {
      "remove": {
        "field": "whisperer.created_at",
        "ignore_missing": true
      }
    },
    {
      "set": {
        "field": "host.name",
        "copy_from": "whisperer.host.name",
        "ignore_empty_value": true
      }
    }
  ],
  "on_failure": [
    {
      "set": {
        "field": "error.pipeline",
        "value": "whisperer"
      }
    },
    {
      "set": {
        "field": "error.message",
        "value": ""
      }
    }
  ]
}
Of course the pipeline is not perfect and can be improved - but it is a good starting point.
Kibana Dashboard
Finally we can browse the data in Kibana:
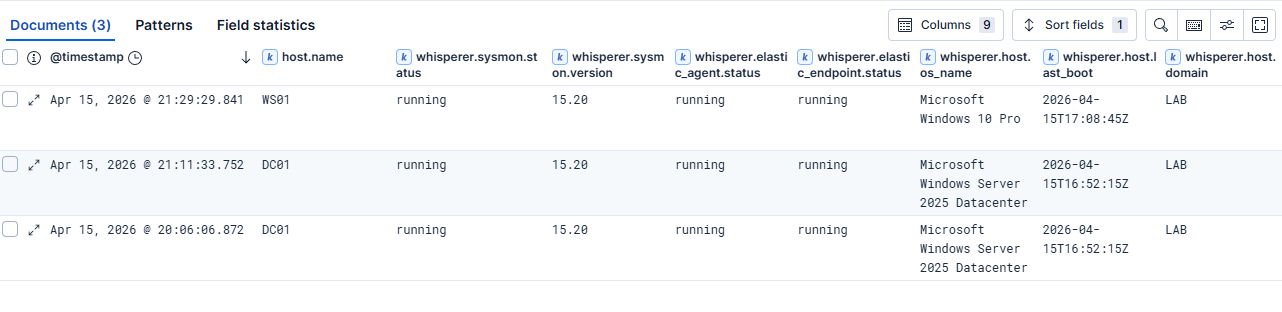
Every workstation in the Active Directory domain is now reporting the status of the agents.
Additionally we can create an Elastic transform to get only the latest status of the agents for each workstation.
Here’s an example of the transform — remember to start it separately after creation with POST _transform/inventory-whisperer/_start:
PUT _transform/inventory-whisperer
{
  "source": {
    "index": [
      "logs-whisperer-default"
    ]
  },
  "latest": {
    "unique_key": [
      "host.name"
    ],
    "sort": "@timestamp"
  },
  "dest": {
    "index": "inventory-whisperer"
  }
}
Detection Opportunities
The Whisperer data isn’t just for operational dashboards. It opens up some interesting detection use cases:
- Agent tampering: if a host that was previously reporting a running Elastic Agent suddenly reports
stoppedornone, that warrants investigation. Adversaries commonly target security tooling early in an attack. We can also catch administrators that are stopping the agents. - Version anomalies: a host running a significantly older agent version than the rest of the fleet may indicate that the agent is broken.
- Defender exclusion changes: new exclusion paths or processes appearing across the fleet outside of a change window are a high-fidelity signal worth alerting on.
- Gaps in telemetry: hosts that stop reporting entirely are a blind spot. Correlating Whisperer check-ins against your SIEM’s endpoint list lets you identify hosts generating no telemetry at all.
Limitations
This is a proof of concept, so there are rough edges. The receiver has no deduplication logic, so a host that reboots twice in a day will submit two records. The script also runs in the context of SYSTEM, which means it can’t capture per-user agent state.
Summary
The Whisperer is a simple but effective way to get visibility into the health of your security tooling across a large Active Directory environment. It costs almost nothing to deploy, generates structured data that integrates naturally into an existing Elasticsearch stack, and surfaces gaps that you simply can’t see from agent-side telemetry alone — because those gaps are, by definition, silent.
The full script is on GitHub. Feedback welcome.