Introduction
This blog post is inspired by Andrew Schwartz (Huntress) and his “From Code to Coverage” series on the Huntress blog:
Goal
The goal is to test how we can build detections for domain enumeration over LDAP. I’ll do this using Windows Event Logs — specifically Applications and Services Logs -> Directory Service, a source I didn’t know about before reading the referenced posts.
Strategy
LDAP is one of the baseline protocols in Active Directory — alongside SMB, NTLM and Kerberos. It’s essential to normal operation, but plenty of pentesting and red team tools rely on it too, the Impacket family being an obvious example.
I wanted to work out whether there’s a good strategy to catch an attacker on LDAP queries alone. Those queries can come from many places — mostly from domain-joined computers, but with valid credentials you can issue them from a non-domain machine too, Windows or Linux.
That’s why, in my opinion, we can’t reliably audit LDAP queries on the client side — it’s impossible to implement properly (e.g. via Microsoft-Windows-LDAP-Client/Debug), because there will always be non-domain-joined hosts: not just computers, but firewalls, appliances, you name it.
Another strategy would be collecting LDAP queries using network security monitoring tools like Zeek or Packetbeat. But this breaks down the moment the traffic is encrypted — and in a default Active Directory environment, much of it is. Encryption comes in two flavors here: LDAPS on port 636 (TLS), and — more easily overlooked — sign-and-seal on port 389, where domain-joined clients negotiate Kerberos/SASL encryption in-band over the “plaintext” port. Either way, a network sensor just sees an opaque blob, and without the session keys there’s no practical way to recover the filter.
So there’s probably only one good way to audit LDAP queries — event 1644 from LDAP Server logging. This logging isn’t enabled by default on domain controllers and is considered debug-level. Its primary purpose is to surface inefficient LDAP queries, but we can repurpose it as a detection source.
Production note: the threshold values below are intentionally aggressive lab settings. Before deploying them broadly, baseline the volume and monitor domain controller load.
Deployment happens on your domain controllers (no restart required).
reg add "HKLM\SYSTEM\CurrentControlSet\Services\NTDS\Diagnostics" /v "15 Field Engineering" /t REG_DWORD /d 5 /f
reg add "HKLM\SYSTEM\CurrentControlSet\Services\NTDS\Parameters" /v "Expensive Search Results Threshold" /t REG_DWORD /d 1 /f
reg add "HKLM\SYSTEM\CurrentControlSet\Services\NTDS\Parameters" /v "Inefficient Search Results Threshold" /t REG_DWORD /d 1 /f
reg add "HKLM\SYSTEM\CurrentControlSet\Services\NTDS\Parameters" /v "Search Time Threshold (msecs)" /t REG_DWORD /d 1 /f
If anything goes wrong and you decide to back it out, just run:
reg add "HKLM\SYSTEM\CurrentControlSet\Services\NTDS\Diagnostics" /v "15 Field Engineering" /t REG_DWORD /d 0 /f
This turns the logging off.
First Test
I started by adding a new integration policy to my lab domain controller. I used Elastic’s Custom Windows Event Logs integration, configured to collect only event 1644. I also added an optional ingest pipeline — it’ll be useful later.
Full API request:
Full Fleet package policy request
PUT kbn:/api/fleet/package_policies/2143f78e-37ac-4c2a-8909-8fa5376348a6
{
  "package": {
    "name": "winlog",
    "version": "2.6.0"
  },
  "name": "windows-directory-service",
  "namespace": "",
  "description": "",
  "policy_ids": [
    "0e3b895f-3e75-42b6-bb29-4ec2f217d7e7"
  ],
  "vars": {},
  "inputs": {
    "winlogs-winlog": {
      "enabled": true,
      "streams": {
        "winlog.winlogs": {
          "enabled": true,
          "vars": {
            "channel": "Directory Service",
            "data_stream.dataset": "windows.directory_service",
            "pipeline": "windows.directory_service@custom",
            "preserve_original_event": false,
            "forwarded": false,
            "providers": [],
            "event_id": "1644",
            "ignore_older": "72h",
            "language": 0,
            "tags": [],
            "custom": "# Winlog configuration example\n#processors:\n# - drop_event.when.not.or:\n# - equals.winlog.event_id: '903'\n# - equals.winlog.event_id: '1024'"
          }
        }
      }
    }
  }
}
After adding it I could browse unparsed logs using filter:
event.provider : "Microsoft-Windows-ActiveDirectory_DomainService"
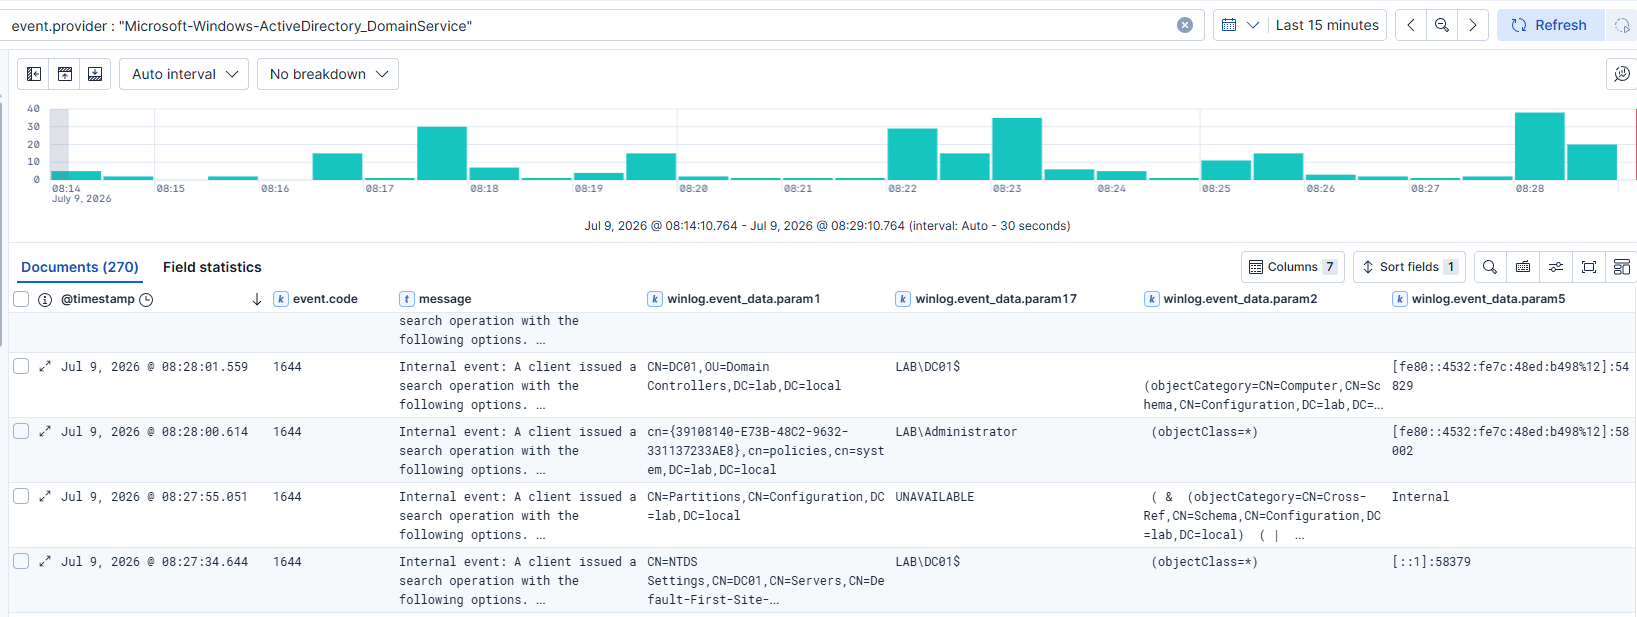
The logs aren’t parsed yet — we get winlog.event_data.param* fields, so some processing will be needed.
The first test was simple. I used Impacket’s GetUserSPNs to find kerberoastable users, mainly to see what it leaves behind in the logs.
┌──(kali㉿kali)-[~]
└─$ impacket-GetUserSPNs 'lab.local/filip_user:<REDACTED>' -dc-ip 10.10.10.10
Impacket v0.14.0.dev0 - Copyright Fortra, LLC and its affiliated companies

ServicePrincipalName    Name     MemberOf  PasswordLastSet             LastLogon  Delegation
----------------------  -------  --------  --------------------------  ---------  ----------
HTTP/svc_lab.lab.local  svc_lab            2026-07-09 08:41:50.596086  <never>
The resulting log looks like this:
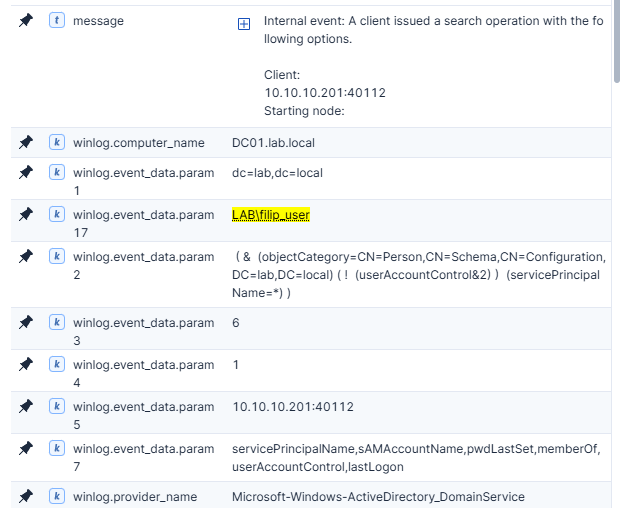
It shows that the client at 10.10.10.201 (my Kali box), authenticated as LAB\filip_user, issued this LDAP query:
( & (objectCategory=CN=Person,CN=Schema,CN=Configuration,DC=lab,DC=local) ( ! (userAccountControl&2) ) (servicePrincipalName=*) )
It requested the fields servicePrincipalName,sAMAccountName,pwdLastSet,memberOf,userAccountControl,lastLogon in return. The domain controller visited 6 objects and returned 1 entry.
Log Parsing and Normalizing
I spotted a few things worth fixing before writing detection rules on top of this. They can be handled with an ingest pipeline or with mappings in Elastic. The issues:
- naming convention —
paramXisn’t meaningful - the client address bundles IP and port together — we could split them
- the attribute list in
param7is a comma-separated string — we could parse it into an array in a separate field - the LDAP filter carries unnecessary whitespace that could break our detections; and since LDAP filters are case-insensitive, we can normalize them to lowercase
Starting with renames and mappings:
| param | target | mapping | additional |
|---|---|---|---|
| param1 | ldap_base_dn | keyword | |
| param2 | ldap_filter | keyword | whitespace normalizer |
| param3 | ldap_entries_visited | long | |
| param4 | ldap_entries_returned | long | |
| param5 | ldap_source_address | keyword | |
| param6 | ldap_scope | keyword | |
| param7 | ldap_attributes_raw | keyword | comma split |
| param8 | ldap_server_controls | keyword | |
| param9 | ldap_used_indexes | keyword | |
| param10 | ldap_pages_referenced | long | |
| param11 | ldap_pages_read_from_disk | long | |
| param12 | ldap_pages_preread_from_disk | long | |
| param13 | ldap_clean_pages_modified | long | |
| param14 | ldap_dirty_pages_modified | long | |
| param15 | ldap_search_time_ms | long | |
| param16 | ldap_attrs_preventing_optimization | keyword | |
| param17 | ldap_bind_user | keyword |
First, the mappings and normalizers. Here’s the full definition:
Full Directory Service component template
PUT _component_template/logs-windows.directory_service@custom
{
  "template": {
    "settings": {
      "analysis": {
        "normalizer": {
          "lowercase_normalizer": {
            "type": "custom",
            "filter": ["lowercase"]
          }
        }
      }
    },
    "mappings": {
      "properties": {
        "winlog": {
          "properties": {
            "event_data": {
              "properties": {
                "ldap_base_dn":     { "type": "keyword", "normalizer": "lowercase_normalizer" },
                "ldap_filter":      { "type": "keyword", "normalizer": "lowercase_normalizer" },
                "ldap_filter_raw":  { "type": "keyword", "index": false },
                "ldap_scope":       { "type": "keyword" },
                "ldap_attributes":     { "type": "keyword", "normalizer": "lowercase_normalizer" },
                "ldap_attributes_raw": { "type": "keyword" },
                "ldap_used_indexes":   { "type": "keyword", "normalizer": "lowercase_normalizer" },
                "ldap_attrs_preventing_optimization": { "type": "keyword" },
                "ldap_bind_user":      { "type": "keyword", "normalizer": "lowercase_normalizer" },
                "ldap_server_controls":      { "type": "keyword", "normalizer": "lowercase_normalizer" },
                "ldap_source_address": { "type": "keyword" },
                "ldap_source_ip":      { "type": "ip" },
                "ldap_source_port":    { "type": "long" },
                "ldap_index_used":     { "type": "boolean" },

                "ldap_entries_visited":         { "type": "long" },
                "ldap_entries_returned":        { "type": "long" },
                "ldap_pages_referenced":        { "type": "long" },
                "ldap_pages_read_from_disk":    { "type": "long" },
                "ldap_pages_preread_from_disk": { "type": "long" },
                "ldap_clean_pages_modified":    { "type": "long" },
                "ldap_dirty_pages_modified":    { "type": "long" },
                "ldap_search_time_ms":          { "type": "long" }
              }
            }
          }
        }
      }
    }
  }
}
I decided to create two pipelines:
- a main pipeline for the whole Directory Service dataset, which routes event 1644 to the second pipeline
- a second pipeline that parses only event 1644
Full API request for the second pipeline:
Full event 1644 parser pipeline
PUT _ingest/pipeline/logs-windows.directory_service.event_1644-parser
{
  "description": "Parses event 1644",
  "processors": [
    {
      "rename": {
        "field": "winlog.event_data.param1",
        "target_field": "winlog.event_data.ldap_base_dn",
        "ignore_missing": true
      }
    },
    {
      "rename": {
        "field": "winlog.event_data.param2",
        "target_field": "winlog.event_data.ldap_filter",
        "ignore_missing": true
      }
    },
    {
      "rename": {
        "field": "winlog.event_data.param3",
        "target_field": "winlog.event_data.ldap_entries_visited",
        "ignore_missing": true
      }
    },
    {
      "rename": {
        "field": "winlog.event_data.param4",
        "target_field": "winlog.event_data.ldap_entries_returned",
        "ignore_missing": true
      }
    },
    {
      "rename": {
        "field": "winlog.event_data.param5",
        "target_field": "winlog.event_data.ldap_source_address",
        "ignore_missing": true
      }
    },
    {
      "rename": {
        "field": "winlog.event_data.param6",
        "target_field": "winlog.event_data.ldap_scope",
        "ignore_missing": true
      }
    },
    {
      "rename": {
        "field": "winlog.event_data.param7",
        "target_field": "winlog.event_data.ldap_attributes_raw",
        "ignore_missing": true
      }
    },
    {
      "rename": {
        "field": "winlog.event_data.param8",
        "target_field": "winlog.event_data.ldap_server_controls",
        "ignore_missing": true
      }
    },
    {
      "rename": {
        "field": "winlog.event_data.param9",
        "target_field": "winlog.event_data.ldap_used_indexes",
        "ignore_missing": true
      }
    },
    {
      "rename": {
        "field": "winlog.event_data.param10",
        "target_field": "winlog.event_data.ldap_pages_referenced",
        "ignore_missing": true
      }
    },
    {
      "rename": {
        "field": "winlog.event_data.param11",
        "target_field": "winlog.event_data.ldap_pages_read_from_disk",
        "ignore_missing": true
      }
    },
    {
      "rename": {
        "field": "winlog.event_data.param12",
        "target_field": "winlog.event_data.ldap_pages_preread_from_disk",
        "ignore_missing": true
      }
    },
    {
      "rename": {
        "field": "winlog.event_data.param13",
        "target_field": "winlog.event_data.ldap_clean_pages_modified",
        "ignore_missing": true
      }
    },
    {
      "rename": {
        "field": "winlog.event_data.param14",
        "target_field": "winlog.event_data.ldap_dirty_pages_modified",
        "ignore_missing": true
      }
    },
    {
      "rename": {
        "field": "winlog.event_data.param15",
        "target_field": "winlog.event_data.ldap_search_time_ms",
        "ignore_missing": true
      }
    },
    {
      "rename": {
        "field": "winlog.event_data.param16",
        "target_field": "winlog.event_data.ldap_attrs_preventing_optimization",
        "ignore_missing": true
      }
    },
    {
      "rename": {
        "field": "winlog.event_data.param17",
        "target_field": "winlog.event_data.ldap_bind_user",
        "ignore_missing": true
      }
    },
    {
      "set": {
        "field": "winlog.event_data.ldap_filter_raw",
        "copy_from": "winlog.event_data.ldap_filter",
        "ignore_empty_value": true
      }
    },
    {
      "gsub": {
        "field": "winlog.event_data.ldap_filter",
        "pattern": """\s+""",
        "replacement": "",
        "ignore_missing": true
      }
    },
    {
      "convert": {
        "field": "winlog.event_data.ldap_entries_visited",
        "type": "long",
        "ignore_missing": true,
        "ignore_failure": true
      }
    },
    {
      "convert": {
        "field": "winlog.event_data.ldap_entries_returned",
        "type": "long",
        "ignore_missing": true,
        "ignore_failure": true
      }
    },
    {
      "convert": {
        "field": "winlog.event_data.ldap_pages_referenced",
        "type": "long",
        "ignore_missing": true,
        "ignore_failure": true
      }
    },
    {
      "convert": {
        "field": "winlog.event_data.ldap_pages_read_from_disk",
        "type": "long",
        "ignore_missing": true,
        "ignore_failure": true
      }
    },
    {
      "convert": {
        "field": "winlog.event_data.ldap_pages_preread_from_disk",
        "type": "long",
        "ignore_missing": true,
        "ignore_failure": true
      }
    },
    {
      "convert": {
        "field": "winlog.event_data.ldap_clean_pages_modified",
        "type": "long",
        "ignore_missing": true,
        "ignore_failure": true
      }
    },
    {
      "convert": {
        "field": "winlog.event_data.ldap_dirty_pages_modified",
        "type": "long",
        "ignore_missing": true,
        "ignore_failure": true
      }
    },
    {
      "convert": {
        "field": "winlog.event_data.ldap_search_time_ms",
        "type": "long",
        "ignore_missing": true,
        "ignore_failure": true
      }
    },
    {
      "script": {
        "if": "ctx.winlog?.event_data?.ldap_source_address != null",
        "lang": "painless",
        "source": """
          def ed = ctx.winlog.event_data;
          String addr = ed.ldap_source_address;
          int idx = addr.lastIndexOf(':');
          if (idx > 0) {
            ed.ldap_source_ip = addr.substring(0, idx).replace("[", "").replace("]", "");
            try {
              ed.ldap_source_port = Integer.parseInt(addr.substring(idx + 1));
            } catch (NumberFormatException e) {}
            if (ctx.source == null) {
              ctx.source = new HashMap();
            }
            ctx.source.ip = ed.ldap_source_ip;
            if (ed.ldap_source_port != null) {
              ctx.source.port = ed.ldap_source_port;
            }
          }
        """
      }
    },
    {
      "split": {
        "field": "winlog.event_data.ldap_attributes_raw",
        "separator": ",",
        "target_field": "winlog.event_data.ldap_attributes",
        "ignore_missing": true
      }
    },
    {
      "script": {
        "if": "ctx.winlog?.event_data?.ldap_used_indexes != null",
        "lang": "painless",
        "source": """
          String idx = ctx.winlog.event_data.ldap_used_indexes.trim();
          ctx.winlog.event_data.ldap_index_used = !(idx.isEmpty() || idx.equalsIgnoreCase('none'));
        """
      }
    }
  ],
  "on_failure": [
    {
      "append": {
        "field": "tags",
        "value": "_ldap_1644_parse_error"
      }
    },
    {
      "append": {
        "field": "error.message",
        "value": "{{{ _ingest.on_failure_message }}}"
      }
    }
  ]
}
After applying the mapping, the ingest pipeline and a rollover, the log looks a lot cleaner:
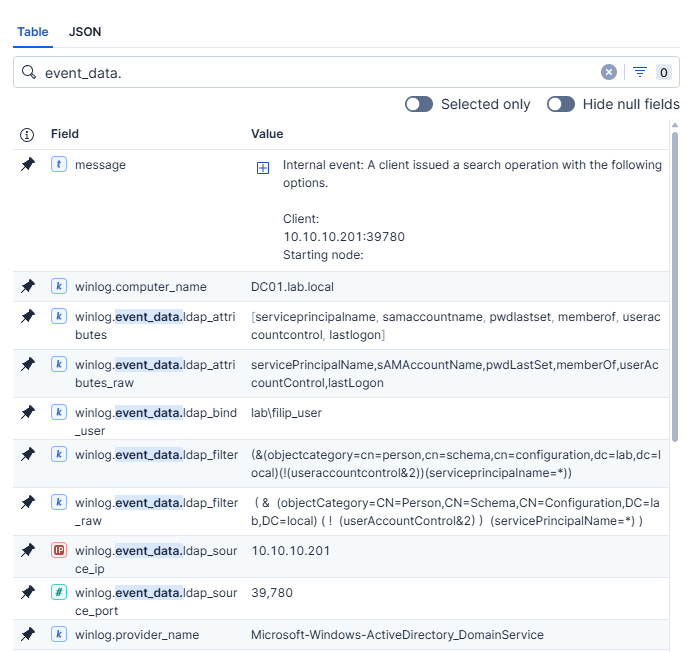
For ldap_attributes we keep two fields — the original, and a normalized array. Same for ldap_filter — one whitespace- and lowercase-normalized version, and the original. Each has its uses. There is one trade-off with stripping whitespace from ldap_filter: a query like displayName=John Doe becomes displayname=JohnDoe, which is no longer valid — which is exactly why keeping the original ldap_filter still matters.
Different Tools for SPN Enumeration
I wanted to try a few different tools that can enumerate SPNs, comparing:
- Impacket’s GetUserSPNs
- NetExec
- bloodyAD
kali@kali:~$ impacket-GetUserSPNs 'lab.local/filip_user:<REDACTED>' -dc-ip 10.10.10.10
Impacket v0.14.0.dev0 - Copyright Fortra, LLC and its affiliated companies

ServicePrincipalName    Name     MemberOf  PasswordLastSet             LastLogon  Delegation
----------------------  -------  --------  --------------------------  ---------  ----------
HTTP/svc_lab.lab.local  svc_lab            2026-07-09 08:41:50.596086  <never>


kali@kali:~$ nxc ldap 10.10.10.10 -u filip_user -p '<REDACTED>' -d lab.local --kerberoasting kerb_out.txt
LDAP        10.10.10.10     389    DC01             [*] Windows 11 / Server 2025 Build 26100 (name:DC01) (domain:lab.local) (signing:Enforced) (channel binding:No TLS cert)
LDAP        10.10.10.10     389    DC01             [+] lab.local\filip_user:<REDACTED>
LDAP        10.10.10.10     389    DC01             [*] Skipping disabled account: krbtgt
LDAP        10.10.10.10     389    DC01             [*] Total of records returned 1
LDAP        10.10.10.10     389    DC01             [*] sAMAccountName: svc_lab, memberOf: [], pwdLastSet: 2026-07-09 08:41:50.596086, lastLogon: <never>
LDAP        10.10.10.10     389    DC01             $krb5tgs$18$svc_lab$LAB.LOCAL$*lab.local\svc_lab*[SNIP]

kali@kali:~$ bloodyad --host 10.10.10.10 -d lab.local -u filip_user -p '<REDACTED>' \
  get search --filter '(&(samAccountType=805306368)(servicePrincipalName=*))' --attr sAMAccountName

distinguishedName: CN=krbtgt,CN=Users,DC=lab,DC=local
sAMAccountName: krbtgt

distinguishedName: CN=svc_lab,CN=Users,DC=lab,DC=local
sAMAccountName: svc_lab
Here’s a comparison of the three resulting logs:
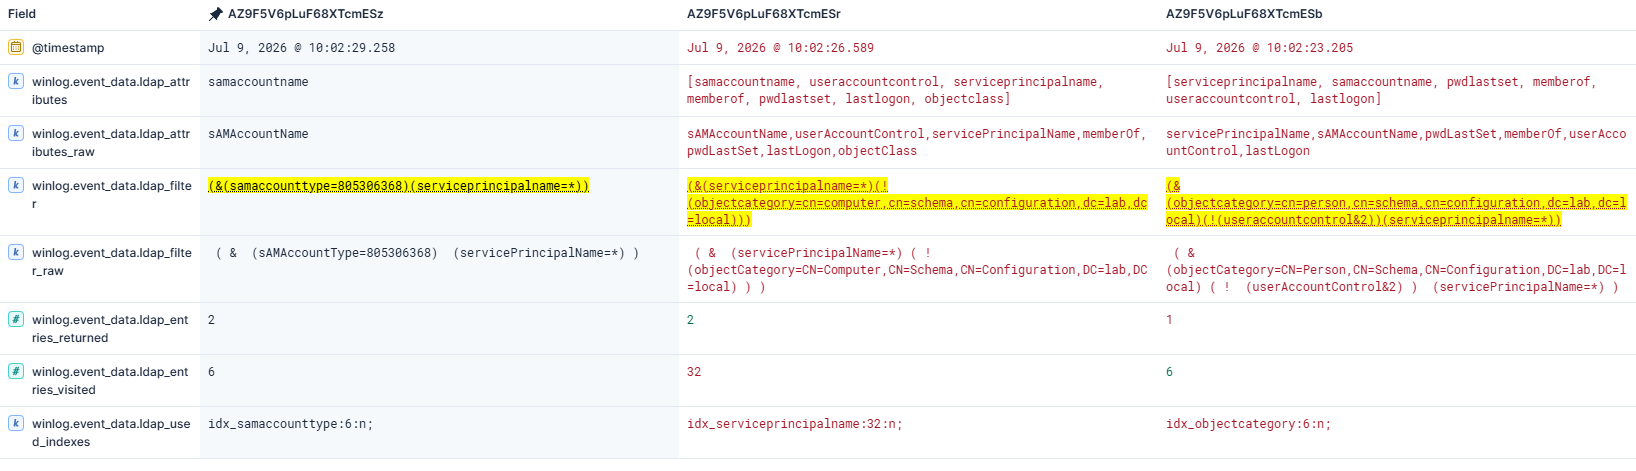
Each tool asks for the exact same thing — user accounts with an SPN set — but builds the LDAP filter in a completely different way:
| Tool | Filter |
|---|---|
| impacket GetUserSPNs | ( & (objectCategory=CN=Person,CN=Schema,CN=Configuration,DC=lab,DC=local) ( ! (userAccountControl&2) ) (servicePrincipalName=*) ) |
| NetExec | ( & (servicePrincipalName=*) ( ! (objectCategory=CN=Computer,CN=Schema,CN=Configuration,DC=lab,DC=local) ) ) |
| bloodyAD | ( & (sAMAccountType=805306368) (servicePrincipalName=*) ) |
The important part: all three tools ask for SPN-bearing users, but none of the filters are text-identical.
Three different ways to say “give me user objects,” none of them overlapping in wording. A detection rule that pattern-matches on any single one of these filters will miss the other two. On the flip side, this also means we can fingerprint tools this way — and since these tools are open-source and popular, it’s worth reading their code too.
It’s also worth noting that NetExec’s LDAP query returned 2 accounts (including krbtgt) and drops krbtgt at the output layer. Impacket is the only one of the three whose filter does the UAC exclusion server-side (!(userAccountControl&2)), which is why it’s also the only one reporting entries_returned: 1.
Query cost isn’t equal either:
| Tool | Filter | Visited | Returned | Ratio |
|---|---|---|---|---|
| impacket | objectCategory=Person + UAC bitwise |
6 | 1 | 6 |
| NetExec | !(objectCategory=computer) |
32 | 2 | 16 |
| bloodyAD | sAMAccountType=805306368 |
6 | 2 | 3 |
NetExec visited 32 objects to return 2 — more than 5x what Impacket and bloodyAD needed for a comparable result. The difference comes down to how well each filter’s leading term can be indexed. objectCategory=Person and sAMAccountType=805306368 are positive, equality-based selectors that the DC can resolve efficiently against an index. !(objectCategory=computer) is a negation — the DC effectively has to consider everything that isn’t a computer before it can apply the SPN check, which is a much wider candidate set in a domain with any meaningful number of objects.
I also tried SPN enumeration with PowerView (powerview.ps1):
Get-DomainUser -SPN
This produced a log similar to bloodyAD’s.
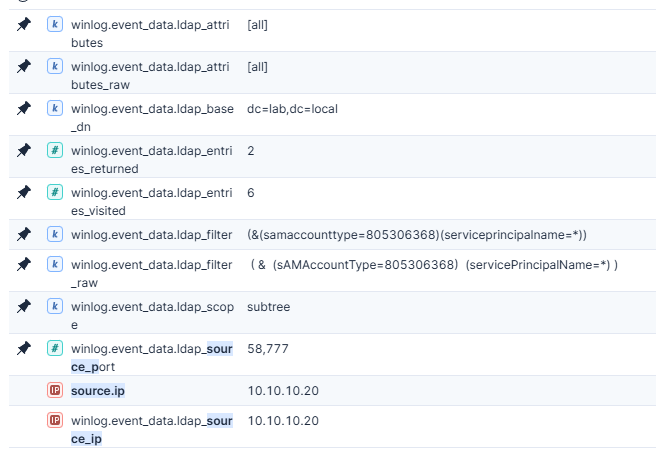
This is a live example of exactly what the Inefficient Search Results Threshold is designed to catch — and a good reminder that in a larger production environment (tens of thousands of objects, not a six-user lab), this gap would be far more pronounced, and would matter for DC load, not just for detection.
Reviewing the Source Code
I decided to check the NetExec source to confirm that what I’d captured actually matched the code — and it didn’t, which is a lesson in itself.
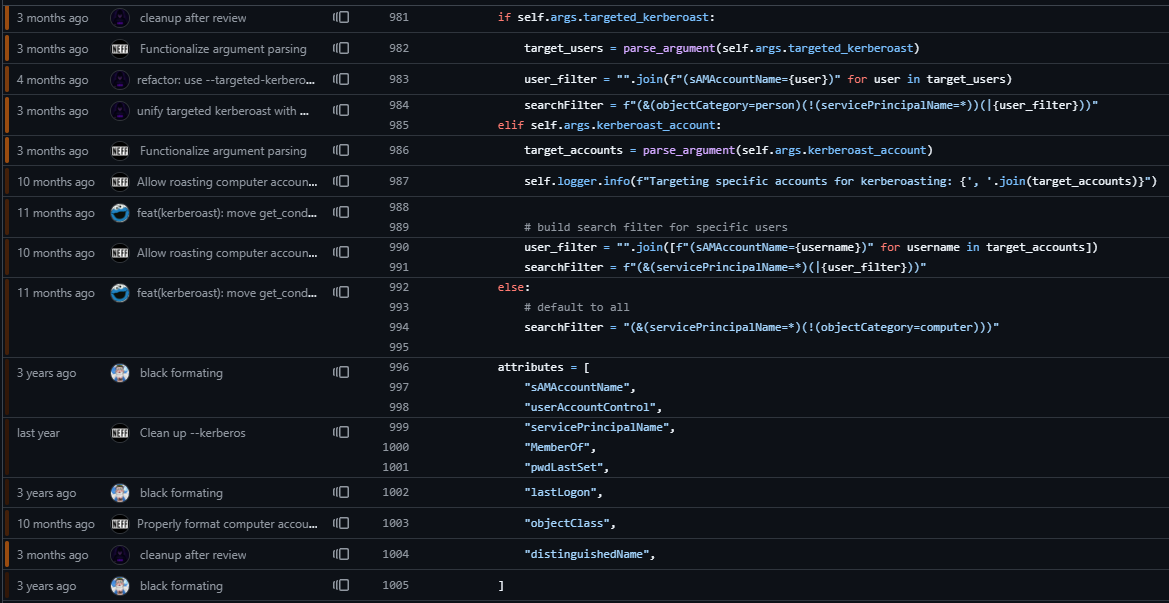
In my lab I used the Kali 2026.1 release, and NetExec had already moved on — someone had added distinguishedName to the requested LDAP attributes, and my captured log didn’t have it. The takeaway: detection rules built on exact LDAP-query matches won’t stand the test of time.
So how do we build a detection rule for LDAP enumeration — kerberoasting specifically? It really depends on the environment.
The strongest signal is the servicePrincipalName=* clause in the filter — but it does have legitimate uses too. That’s why I’d start by collecting a few weeks of data in production, then work out what’s normal: which users and IPs query for it, and what their filters look like. Only then would I deploy the detection rule — and test it against a few tools. Does it catch every one of them?
We can start with this hunting query:
FROM logs-windows.directory_service-*

| WHERE event.code == "1644"

    AND winlog.event_data.ldap_filter LIKE "*serviceprincipalname=*"

    //AND NOT winlog.event_data.ldap_source_ip IN ("REPLACE_WITH_BASELINE_EXCLUSIONS")

    //AND NOT winlog.user.name IN ("REPLACE_WITH_SERVICE_ACCOUNTS")

| EVAL bucket = DATE_TRUNC(5 minutes, @timestamp)

| STATS

    query_count = COUNT(*),

    max_entries_returned = MAX(winlog.event_data.ldap_entries_returned),

    max_entries_visited = MAX(winlog.event_data.ldap_entries_visited),

    distinct_filters = COUNT_DISTINCT(winlog.event_data.ldap_filter),

    distinct_targets = COUNT_DISTINCT(winlog.event_data.ldap_base_dn)

  BY bucket, winlog.event_data.ldap_source_ip, winlog.user.name

| SORT bucket DESC
Later, we can also correlate this with event 4769 - A Kerberos service ticket was requested.
Trying Harder: bloodhound-ce-python
BloodHound is a well-known Active Directory attack-path management tool, beloved by both blue and red teamers. One of its ingestor implementations is bloodhound-ce-python — so I decided to run it and see what shows up in the logs.
Going all in with the -c All flag:
kali@kali:~$ bloodhound-ce-python -u filip_user -p '<REDACTED>' -d lab.local -c All --zip -dc dc01.lab.local -ns 10.10.10.10 --use-ldaps
INFO: BloodHound.py for BloodHound Community Edition
INFO: Found AD domain: lab.local
INFO: Getting TGT for user
INFO: Connecting to LDAP server: dc01.lab.local
INFO: Found 1 domains
INFO: Found 1 domains in the forest
INFO: Found 2 computers
INFO: Connecting to LDAP server: dc01.lab.local
INFO: Found 7 users
INFO: Found 55 groups
INFO: Found 5 gpos
INFO: Found 1 ous
INFO: Found 19 containers
INFO: Found 0 trusts
INFO: Starting computer enumeration with 10 workers
INFO: Querying computer: WS.lab.local
INFO: Querying computer: DC01.lab.local
INFO: Done in 00M 01S
INFO: Compressing output into 20260709113619_bloodhound.zip
It’s necessarily loud: in my lab it generated 39 log entries. After some digging, I found a few interesting patterns.
Seven queries carrying the ACL collection control is exactly what I’d expect from -c All: BloodHound’s ACL collection method reads the DACL (and owner) off every object type it cares about — the domain root, GPOs, OUs, containers, groups, users, and computers. Each object category gets its own LDAP round-trip, and each one carries SDflags:0x5; — Owner (1) + DACL (4). No Group (2), no SACL (8): Group is a legacy attribute nobody uses for access control anymore, and SACL requires SeSecurityPrivilege, which a regular domain user like filip_user doesn’t have. BloodHound doesn’t bother asking for something it already knows it can’t read.
BloodHound ACL collection signal
Here’s the actual log — very interesting, and specific to BloodHound:
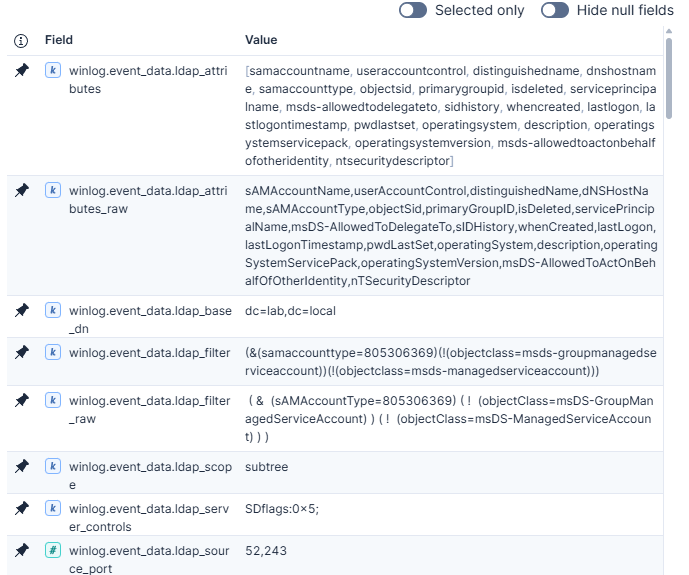
So what does this log tell us?
The LDAP filter is querying for every computer object in the domain, excluding gMSA and MSA service accounts. Scope is subtree, from the domain root dc=lab,dc=local — BloodHound already knows exactly what it’s looking for via sAMAccountType, so it doesn’t need to walk the tree container by container the way it does for OU/container discovery.
Two attributes in the request list matter most: msDS-AllowedToDelegateTo and msDS-AllowedToActOnBehalfOfOtherIdentity. These drive Kerberos delegation abuse detection — constrained and resource-based constrained delegation — one of the most common privilege escalation paths in real Active Directory compromises, and a staple of attack path enumeration.
The other detail worth pulling apart is ldap_server_controls, which shows SDflags:0x5; — the LDAP Security Descriptor control. A security descriptor has four sections, each mapped to a bit: Owner (1), Group (2), DACL (4), SACL (8). 0x5 = 1+4, so BloodHound is asking for Owner and DACL only. It skips Group — a legacy field with no modern relevance to access control — and skips SACL, which requires SeSecurityPrivilege, a right a regular domain user like filip_user doesn’t have. There’s no point asking for something you already know you can’t read.
The DACL is the part that matters, and it’s the strongest signal in this whole query. It describes who can do what to that object — the exact data BloodHound needs to build attack path edges like GenericWrite, GenericAll, and WriteDacl. A single forgotten permission granted years ago and never revoked is often the difference between “just a domain user” and “path to Domain Admin,” and reading the DACL of every computer in the domain in one pass is how BloodHound finds those paths systematically instead of one lucky guess at a time.
For threat hunters and detection engineers, this is a useful, fairly rare signal: 1644 events carrying an SDflags control from a regular user account aren’t something you’d expect to see routinely in most environments, and clusters of them across many object types in a short window are a strong BloodHound/SharpHound-style indicator. One caveat worth building into any rule before relying on it: the DC itself generates legitimate SDflags-bearing queries too — a self-query as SYSTEM over the loopback address showed up earlier in this series (a DNSSEC zone lookup, carrying SDflags:0x7;). Exclude SYSTEM/loopback sources first, and this becomes a clean, high-value signal rather than one buried in DC housekeeping noise.
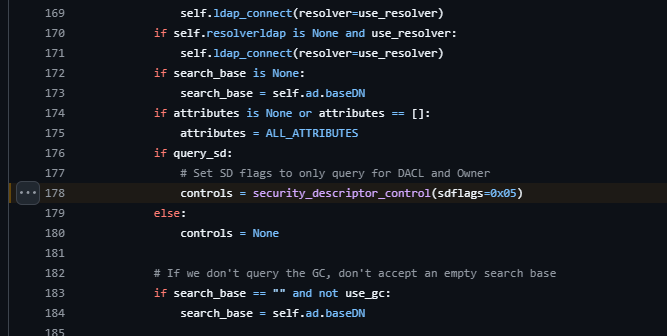
The sdflags=0x05 value isn’t computed ad hoc — it’s set once in bloodhound-ce-python’s search() method, and every collection function (get_computers, get_groups, get_gpos, get_ous, get_containers, get_users) follows the same pattern: a single acl flag both appends nTSecurityDescriptor to the attribute list and sets query_sd=True, which is what puts SDflags on the wire. That’s why the two consistently show up together in the logs — it’s not a correlation to notice, it’s one switch controlling both.
Source: domain.py#L178
Domain root ACL read
Another log worth explaining:
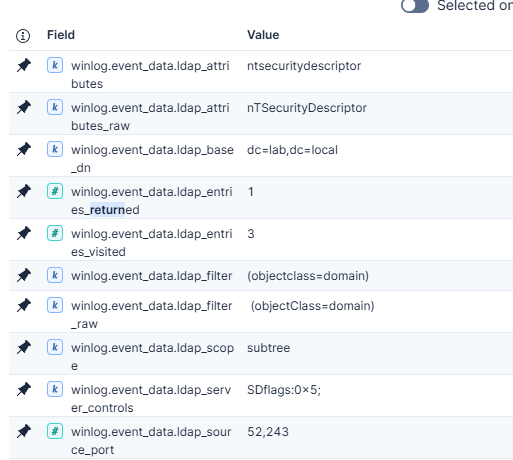
The domain root ACL — the highest-value single query in this capture
Filter: (objectClass=domain), base DN dc=lab,dc=local, scope subtree, SDflags:0x5;, returned: 1, visited: 3.
This is get_domains() in the source — the same acl switch, the same nTSecurityDescriptor + SDflags:0x5 pairing seen on computers, groups, GPOs and containers, but this time pointed at the domain object itself. It’s a tiny, cheap query (three objects visited to find the one domain root), but it’s arguably the single most important ACL read in the entire collection.
Here’s why: the right to perform DCSync — replicating every account’s password hash out of AD, including krbtgt — isn’t a property of a user account. It’s an entry in the DACL of the domain object, granted through two extended rights: Replicating Directory Changes and Replicating Directory Changes All. There’s no other place to look for it. To find out who can DCSync, you have to read the domain root’s DACL.
That’s what this query is for. If a forgotten WriteDacl, GenericAll, or a directly-granted replication right is sitting on this one object — say, from a service account provisioning script five years ago that nobody ever cleaned up — this single read exposes it. No prior foothold beyond a standard domain user bind is required to find it; only to exploit it. It’s a good illustration of how much leverage a handful of small, cheap LDAP queries can carry when they’re pointed at exactly the right objects.
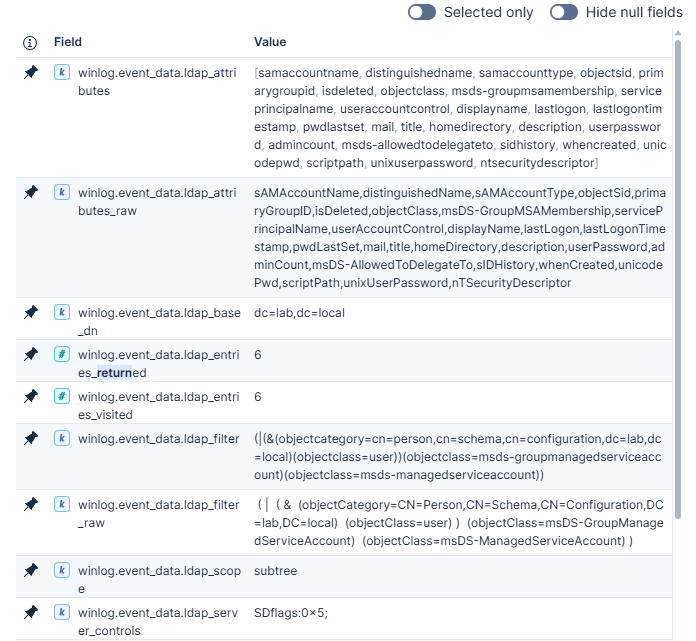
The users query — asking for what you already know you can’t have
Filter: (|(&(objectCategory=CN=Person,CN=Schema,CN=Configuration,DC=lab,DC=local)(objectClass=user))(objectClass=msDS-GroupManagedServiceAccount)(objectClass=msDS-ManagedServiceAccount)), scope subtree, SDflags:0x5;, returned: 6, visited: 6.
This is get_users() — same efficient, well-indexed pattern as the rest of the capture, same SDflags:0x5 ACL read. The filter matches regular user accounts plus gMSA and MSA service accounts in one pass, which is why it’s an OR of three branches instead of a single condition.
Two things worth pulling out of the 26-attribute request list. msDS-AllowedToDelegateTo and msDS-GroupMSAMembership are delegation-adjacent — the first flags constrained delegation targets, the second controls who’s allowed to retrieve a group-managed service account’s password. Both feed the same attack-path graph as the computer and domain-root queries covered earlier.
The more interesting detail is further down the list: userPassword, unicodePwd, unixUserPassword. None of these should return a value over a standard LDAP read — unicodePwd is blocked at the protocol level regardless of who’s asking, and the other two are legacy/POSIX fields essentially unused in a Windows-only environment. Asking for them isn’t a mistake, it’s what exhaustive collection looks like: a tool built to enumerate everything that might matter asks for it anyway, because filtering “is this worth requesting” isn’t its job. A hand-written admin query never does this — there’s no reason to ask for something you already know the server won’t give you.
That makes this a good standalone, high-confidence indicator, independent of the ACL/SDflags signal covered above:
Sample KQL query:
event.code : "1644" and winlog.event_data.ldap_attributes : ("unicodepwd" OR "userpassword")
So is there a good rule for catching BloodHound-like enumeration? Through some trial and error I arrived at this one — note that it has to be tuned to your production environment:
FROM logs-windows.directory_service-*

| WHERE event.code == "1644"

| STATS query_count = COUNT(*),

        unique_filters = COUNT_DISTINCT(winlog.event_data.ldap_filter),

        source_ports = COUNT_DISTINCT(winlog.event_data.ldap_source_port),

        acl_queries = COUNT(*) WHERE winlog.event_data.ldap_server_controls LIKE "*SDflags*"

          OR MV_CONTAINS(winlog.event_data.ldap_attributes, "ntsecuritydescriptor"),

        sensitive_attr_queries = COUNT(*) WHERE MV_CONTAINS(winlog.event_data.ldap_attributes, "unicodepwd")

          OR MV_CONTAINS(winlog.event_data.ldap_attributes, "userpassword")

          OR MV_CONTAINS(winlog.event_data.ldap_attributes, "unixuserpassword"),

        rbcd_or_delegation_queries = COUNT(*) WHERE MV_CONTAINS(winlog.event_data.ldap_attributes, "msds-allowedtoactonbehalfofotheridentity")

          OR MV_CONTAINS(winlog.event_data.ldap_attributes, "msds-allowedtodelegateto"),

        gmsa_queries = COUNT(*) WHERE MV_CONTAINS(winlog.event_data.ldap_attributes, "msds-groupmsamembership"),

        sid_lookup_queries = COUNT(*) WHERE winlog.event_data.ldap_filter LIKE "*objectsid=s-1-5-21*",

        treewalk_queries = COUNT(*) WHERE winlog.event_data.ldap_filter LIKE "*objectclass=container*"

          AND winlog.event_data.ldap_filter LIKE "*objectclass=organizationalunit*"

          AND winlog.event_data.ldap_filter LIKE "*samaccounttype=805306369*"

          AND winlog.event_data.ldap_filter LIKE "*objectclass=group*",

        total_visited = SUM(winlog.event_data.ldap_entries_visited),

        total_returned = SUM(winlog.event_data.ldap_entries_returned),

        first_seen = MIN(@timestamp),

        last_seen = MAX(@timestamp)

  BY bucket = BUCKET(@timestamp, 60 seconds),

     src = winlog.event_data.ldap_source_ip,

     bind_user = winlog.event_data.ldap_bind_user

| WHERE query_count >= 10

  AND unique_filters >= 5

  AND acl_queries >= 3

  AND (

    sensitive_attr_queries >= 1

    OR rbcd_or_delegation_queries >= 1

    OR gmsa_queries >= 1

    OR (

      sid_lookup_queries >= 5

      AND treewalk_queries >= 5

    )

  )

| SORT bucket DESC
In my lab environment, it produces:
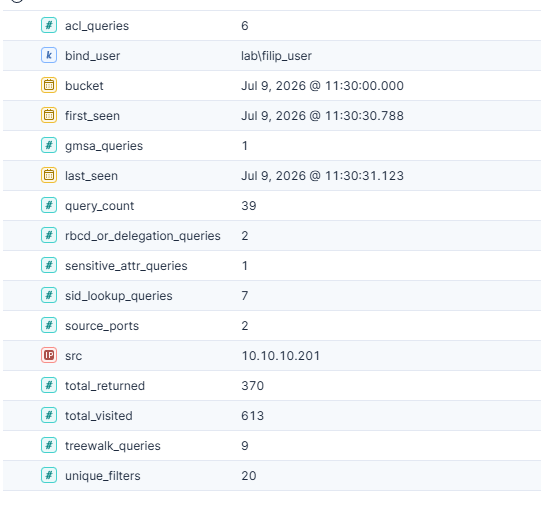
Having caught bloodhound-ce-python, I tried the same against the traditional SharpHound.exe with the same -c all flag:
.\SharpHound.exe -c all
2026-07-09T13:25:54.7565215+02:00|INFORMATION|This version of SharpHound is compatible with the 5.0.0 Release of BloodHound
2026-07-09T13:25:54.7877834+02:00|INFORMATION|SharpHound Version: 2.13.0.0
2026-07-09T13:25:54.7877834+02:00|INFORMATION|SharpHound Common Version: 4.6.2.0
[...]
2026-07-09T13:25:58.3318295+02:00|INFORMATION|Status: 317 objects finished (+317 158.5)/s -- Using 71 MB RAM
2026-07-09T13:25:58.3318295+02:00|INFORMATION|Enumeration finished in 00:00:02.8277505
2026-07-09T13:25:58.4154637+02:00|INFORMATION|Saving cache with stats: 16 ID to type mappings.
 1 name to SID mappings.
 2 machine sid mappings.
 4 sid to domain mappings.
 0 global catalog mappings.
2026-07-09T13:25:58.4494749+02:00|INFORMATION|SharpHound Enumeration Completed at 1:25 PM on 7/9/2026! Happy Graphing!
It was caught by the same query — but much noisier!
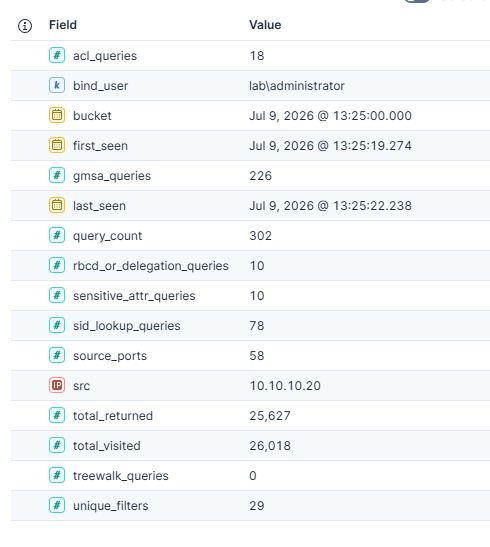
This means the query is genuinely tool-agnostic — the same logic caught two different BloodHound ingestors.
One important caveat: this catches an impatient attacker. A more careful one could be stealthier and more patient, and the 60-second time bucket might be too short to catch them.
Limitations
Detecting tools like Impacket or SharpHound is satisfying. But there are trickier ones, because they go through ADWS instead of talking to LDAP directly. One of them is the good old Active Directory PowerShell module. I tried enumerating user SPNs with the following query:
Get-ADUser -Filter {ServicePrincipalName -like "*"} -Properties ServicePrincipalName,PasswordLastSet,MemberOf,LastLogonDate,Enabled |
    Select-Object Name,ServicePrincipalName,PasswordLastSet,LastLogonDate,Enabled
It worked — but because it went through ADWS, the log tells a completely different story:
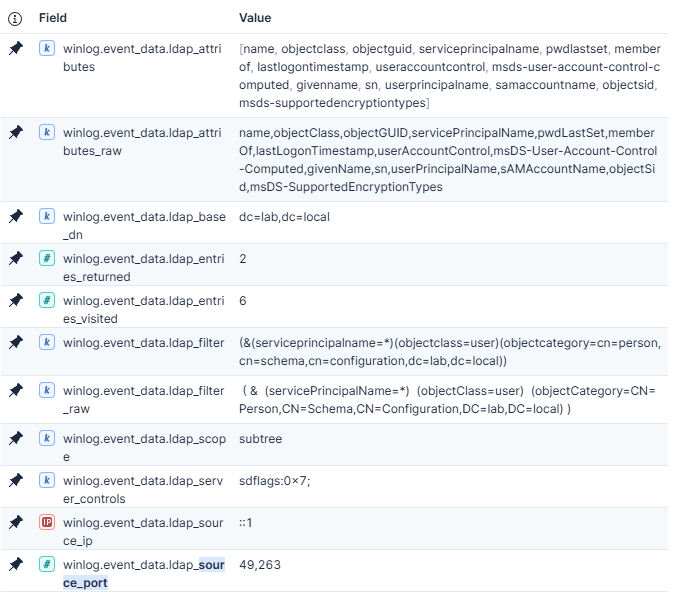
We can see that the users were indeed enumerated for SPNs, but this time source.ip is a loopback address, so it looks like the DC queried itself. This happens because the PowerShell ActiveDirectory module never talks to LDAP directly. It sends SOAP requests to Active Directory Web Services (ADWS), listening on TCP/9389 on the DC. ADWS translates each request into an LDAP search and runs it locally, against the DC’s own directory over the loopback interface, while impersonating the calling user. So the LDAP server — the component that writes event 1644 — sees the search as originating from the ADWS process on the box itself and records the client address as ::1. My actual client — the Kali host — never appears in the 1644 telemetry at all.
This cuts two ways for detection. First, anything keyed on ldap_source_ip — correlation, per-source thresholds, segment logic — is blind to ADWS-routed tooling, because every such query collapses onto loopback. Second, the content of the search is still fully logged: the filter, the attribute list, the SDflags control all land in 1644 exactly as before. You lose the origin, not the behaviour.
The benign example here is the AD PowerShell module, but the same path is exactly what SOAPHound was built to abuse — it collects over ADWS specifically to sidestep direct-LDAP network detection and muddy source attribution. Same mechanism, opposite intent.
MITRE ATT&CK Mapping
Everything in this post lives in the post-foothold reconnaissance phase: an authenticated attacker with a single domain user, mapping the directory over LDAP. Mapped to ATT&CK:
| Technique | Tactic | Where it shows up in this post |
|---|---|---|
| T1087.002 — Account Discovery: Domain Account | Discovery | All the SPN enumeration (Impacket, NetExec, bloodyAD, PowerView) and BloodHound’s user/computer sweeps. |
| T1018 — Remote System Discovery | Discovery | BloodHound’s computer-object enumeration (sAMAccountType = machine account). |
| T1069.002 — Permission Groups Discovery: Domain Groups | Discovery | BloodHound’s group enumeration, plus the DACL / nTSecurityDescriptor reads (SDflags:0x5) that map who holds rights over what. |
| T1482 — Domain Trust Discovery | Discovery | BloodHound’s trust collection under -c All. |
| T1615 — Group Policy Discovery | Discovery | BloodHound’s GPO, OU and container collection. |
| T1558.003 — Steal or Forge Kerberos Tickets: Kerberoasting | Credential Access | The servicePrincipalName=* discovery step that precedes every Kerberoast — the target of the dedicated hunting query above. |
| T1003.006 — OS Credential Dumping: DCSync | Credential Access | Not executed here, but the domain-root DACL read ((objectClass=domain) + SDflags:0x5) is precisely the recon that reveals who can DCSync. |
Relevant software entries for reference: BloodHound (S0521) and Impacket (S0357).
Two honest caveats on this mapping. First, most of these techniques are dual-use — the same LDAP queries are issued constantly by legitimate admin tooling, which is why the detections above lean on behavioural aggregation (volume, distinct filters, ACL-read clustering) rather than on any single filter. Second, following straight from the Limitations section: this mapping assumes the tooling talks to LDAP directly. Anything routed through ADWS (the PowerShell AD module, SOAPHound) performs the very same techniques but changes the telemetry — the behaviour still lands in Event 1644, but the source attribution collapses to loopback.
Summary
Everything here started from someone else’s work — the Huntress LDAP detection series. That’s worth saying plainly: you don’t need to invent a technique from scratch to get value out of it. Take good published research, drop it into a lab, and make it your own. A big part of getting better at detection engineering is just reproducing what other people already figured out, until you understand it well enough to push it a step further.
And the lab is where the actual learning happened. Reading about event 1644 is one thing; running Impacket, NetExec, bloodyAD, BloodHound and SharpHound against a DC and watching what each one leaves behind is another. You can’t reason your way to the fact that NetExec visits 32 objects to return 2, or that BloodHound reads the entire domain-root DACL in a single three-object query — you have to run it and look. A detection lab is what turns “this should work” into “I watched it work.”
It also let me test two different things at once: the tools’ behaviour and my rules. Behaviour, because the whole point of this post is that several tools asking for the exact same thing emit completely different LDAP filters — so anything matching on filter text is fragile, and the NetExec source-code detour proved it (the code had already moved on from what my log captured). Rules, because a detection you’ve never fired against a real tool is just a guess. The payoff was the behavioural rule that caught both bloodhound-ce-python and SharpHound with identical logic — that’s the line between fingerprinting one binary and detecting a technique.
None of this would have worked on a default-configured DC. Event 1644 isn’t enabled out of the box, it’s considered debug-level, and it lives in a log most SOCs never open. That turned out to be the whole story: auditing LDAP queries is effectively impossible on the client side and defeated by sign-and-seal on the wire, so a debug-level directory log was the only real vantage point left. The lesson generalises — some of the best detection sources are the ones nobody bothers to turn on.
It’s also not a finished, bulletproof detection, and I tried to be honest about that. ADWS shifts the picture entirely — you keep the behaviour, but lose the source — and a patient attacker can spread collection thin enough to slip under any time window. Detection engineering doesn’t really have a “done” state: you ship something that raises the cost for the attacker, watch how it behaves in production, and iterate. This is one more source to add to that loop — and a genuinely fun one.